How should you decide which social media metrics your nonprofit should really pay attention to?
Sure, you could make a case for tracking every number that the social media companies give you. But let’s face it . . . that’s a ridiculous waste of your time.
So many social media metrics provided to nonprofits are there because it’s easy for the companies to give you those numbers, not because they are actually of any real value to you.
Here’s an abbreviated version of the process I recommended today to our All-Access Pass Holders during one of our special nonprofit marketing and communications workshops called Jump Starters.
Step 1: What is the point of your social media work, really?
We have data from the 2023 Nonprofit Communications Trends Report about the social media objectives nonprofits are pursuing.
But really, it boils down to two related questions:
- At what level are you good with on-platform engagement alone?
- At what level do you need follow-throughs on calls to action, such as clicks off social to your website where another action may occur?
During the training, I asked participants to decide that ratio for themselves. For example, are they good with 80% on-platform engagement / 20% calls to action, or the reverse, or somewhere in the middle?
This is just another way to talk about your goals for social media. But it also has a big impact on which numbers you watch most closely.
Step 2: Start with what you actually have control over without spending
When we talk about social media metrics, we talk about Activity, Reach, Engagement, and Impact.
You can buy Reach on social media with ad dollars.
But it makes no sense to spend your money without first analyzing your Activity. I recommend that you look at three characteristics of the content you are producing:
- Frequency of posts — how often do you post on average per week or month?
- Topics of posts — what are some easy ways to categorize what you talking about in your posts? Think about maybe 3-5 categories. For example, a farmers market might post about
- Farmers and other people posts
- What’s in season now; products farmers are bringing to market
- Events at the farmers market
- Formats of posts — Are you using images, videos, text only, or links? You can also get more specific (live video versus recorded, or graphics versus photos as your images)
Step 3: Look at the “Engagement” over “Reach”
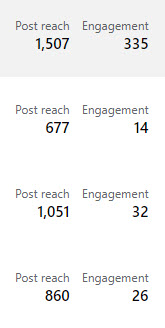
Now you know what you are posting. With those categories in mind, now you can look at both the Reach and Engagement numbers. Reach is how many people saw it; Engagement is how many people did something with it (liked, commented, shared, clicked). We used Meta metrics (Facebook and Instagram) to keep this simple, but the same concepts apply everywhere. The metrics will just be a little different.
You’ll look at Reach and Engagement from two perspectives.

The first is a bigger-picture number that’s more focused on the people. Let’s say over the last 28 days, Facebook says your “post reach” is 23,366 people. That is the number of people who saw any of your posts at least once. And Facebook also says your “post engagement” was 2,869. That is the number of reactions, comments, shares, and clicks on your posts.
I recommend you divide Post Engagement by Post Reach. So in this case it’s 2869 divided by 23366, which is 0.12. This is a decent metric for the overall performance of your content on Facebook. Based on the number of people seeing it, how much engagement are you getting in a given month? Now, you can use that as a benchmark and try to increase that over time.
You can also look at Post Engagement over Followers. But honestly, I really prefer the Engagement over Reach numbers because those are the actual people seeing the content, regardless of whether they follow you or not. We all know that not all of your followers see the content.
Next, you’ll get into the post-level data, and this is where you need those post topics and formats from above.
Meta tells you what your top posts are by Reach and by Engagement.

I recommend you keep track of the top 5 to 10 per month if you post several times a week.
- Top posts by Reach
- Top posts by Engagement
- Top posts by Engagement / Reach (yes, you have to do that math again)
- Changes in Reach or Engagement across your post topics and formats. Put them in order! Which topics got the best reach and engagement? Which formats?
This is what can help you make better decisions about your content strategy!
Step 4: Stop there with engagement or continue on to impact metrics
If you are mostly happy with on-platform engagement, you can stop here. Make your spreadsheet and start tracking. You’ll be off to a great start!
If you are more interested in calls to action, then you’ll need to get more specific about what that looks like. For most of you, it’s diving into that engagement number to separate out the Clicks specifically. You can then run the numbers above, but replace the full Engagement number with just the Clicks.
Can you do A LOT more than this? Of course. Do you need to? For most of you who are just trying to produce the most engaging content you can, this is plenty.


